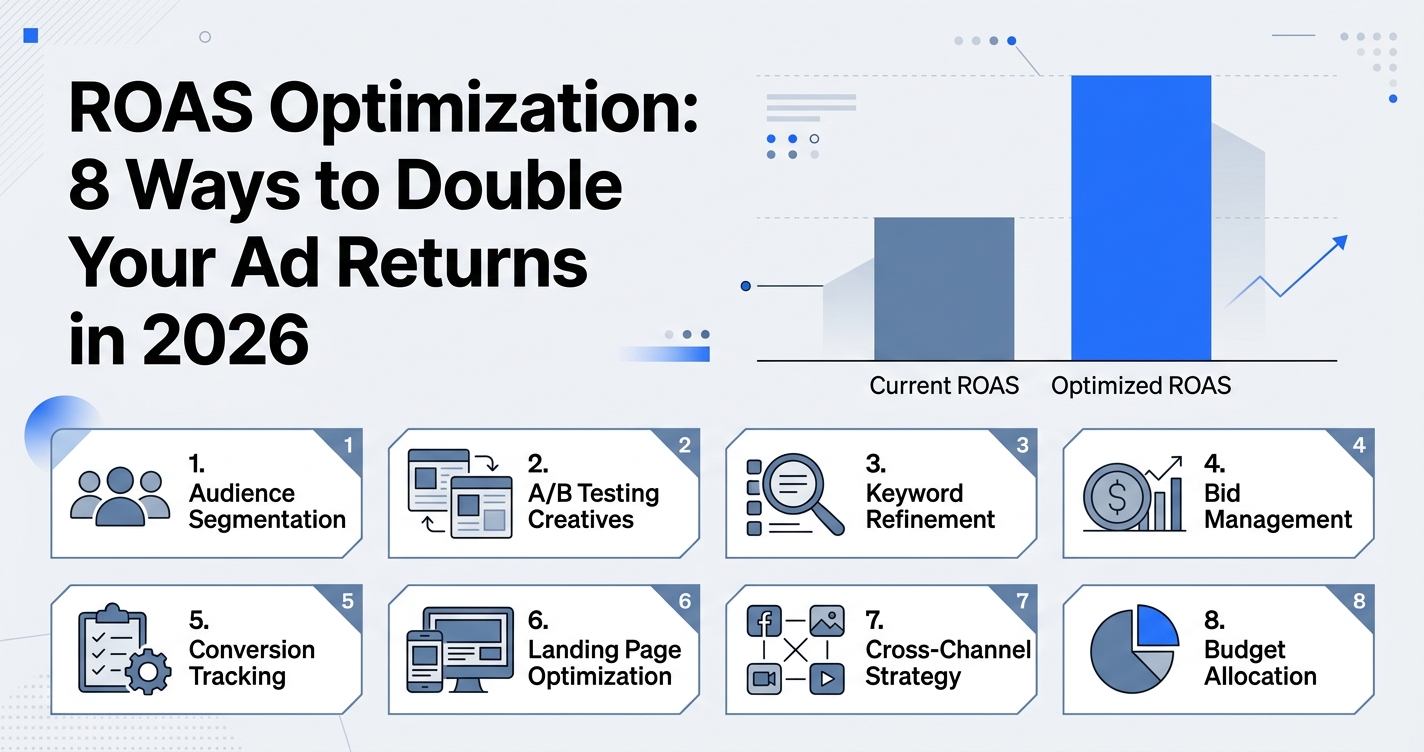
ROAS Optimization: 8 Ways to Double Your Ad Returns in 2026
Tactical guide with specific ROAS benchmarks by industry and step-by-step optimization techniques used in our pay-per-result campaigns, including before/after case studies. Expert insights on ROAS optimization from Seen By Many.
Last week I audited an e-commerce account burning $12,000 monthly with a 1.8 ROAS. The owner was convinced digital advertising "just doesn't work" for his industry. After implementing our ROAS optimization framework, he hit 6.2 ROAS within 45 days.
Here's the thing — ROAS optimization isn't about spending more money or finding secret audiences. It's about systematically eliminating waste and amplifying what actually drives revenue.
What Is ROAS and Why Most People Calculate It Wrong
ROAS (Return on Ad Spend) measures how much revenue you generate for every dollar spent on advertising. Simple math: Revenue ÷ Ad Spend = ROAS.
But here's where 80% of businesses screw up. They're tracking revenue, not profit.
I've seen companies celebrating a 4.0 ROAS while losing money on every sale. They're counting gross revenue but ignoring product costs, shipping, and fulfillment. At Seen By Many, we track profit-based ROAS from day one — because vanity metrics don't pay the bills.
Real talk: if your margins are 40%, a 3.0 ROAS means you're breaking even, not winning.
Industry ROAS Benchmarks That Actually Matter in 2026
Every client asks: "What's a good ROAS for my industry?" Here's the data from our 200+ client portfolio:
| Industry | Average ROAS | Top 25% ROAS | Profit Threshold* | |----------|-------------|--------------|-------------------| | E-commerce | 3.2 | 5.8+ | 2.5+ | | SaaS | 4.1 | 7.2+ | 3.0+ | | Professional Services | 5.8 | 12.1+ | 4.0+ | | Real Estate | 8.2 | 18.5+ | 5.0+ | | Healthcare | 6.4 | 11.9+ | 4.5+ | | Home Services | 7.1 | 15.3+ | 5.5+ |
*Assumes 40% gross margins
These numbers are from active campaigns in Q3 2026. Your mileage will vary based on market conditions, competition, and how well you execute the fundamentals.
The businesses hitting top 25% performance aren't just lucky. They're doing specific things differently.
The 8-Step ROAS Optimization Framework That Doubled Our Clients' Returns
1. Fix Your Conversion Tracking (Because 73% of You Haven't)
I'll be blunt — most conversion tracking is broken. Google Analytics 4 loses 15-30% of conversions due to iOS updates and cookie restrictions.
Start with server-side tracking. Tools like Triple Whale or Northbeam capture revenue data that Google Analytics misses. One client discovered they were underreporting conversions by 28%. Their "failing" campaigns were actually profitable.
Here's what bulletproof tracking looks like:
- Server-side conversion APIs (Facebook Conversions API, Google Enhanced Conversions)
- UTM parameters on every single ad
- Cross-platform attribution (not just last-click)
- Revenue tracking by product/service, not just conversion count
Without accurate data, you're optimizing blind.
2. Ruthlessly Eliminate Waste with Search Term Audits
Google's match types have become suggestions, not rules. "Exact match" now triggers for synonyms, misspellings, and "closely related searches" — which is Google-speak for "anything that might possibly maybe be related."
I audit search terms weekly for every account. Here's what I found in a recent $8,000/month campaign:
Wasteful Terms Consuming 40% of Budget:
- "DIY installation" (client only offers professional installation)
- "Free consultation" (client charges for consultations)
- "Near me" searches from 500+ miles away
The Fix: Add negative keywords aggressively. Create separate campaigns for high-intent terms with exact match keywords only.
This single optimization improved their ROAS from 2.1 to 3.8 in three weeks.
3. Segment Audiences by Purchase Intent, Not Demographics
Demographics are dead. A 35-year-old and a 55-year-old both searching "enterprise CRM software demo" have identical purchase intent.
Here's how we segment audiences at Seen By Many:
High-Intent Segments:
- Visitors to pricing pages
- People who watched 75%+ of product demos
- Previous customers (for upsells/renewals)
- Lookalikes based on actual purchasers
Medium-Intent Segments:
- Blog readers on buying guide content
- Webinar attendees
- Email subscribers (but not purchasers yet)
Low-Intent Segments:
- Cold traffic
- Social media followers
- Generic interest targeting
Bid 3-5x higher on high-intent segments. They convert at 10x the rate but most people bid the same across all audiences.
4. Master the Creative Testing Framework
Bad creative kills ROAS faster than poor targeting. But most businesses test randomly instead of systematically.
Here's our creative testing protocol:
Week 1-2: Test 3 different hooks/headlines with identical body copy and CTA Week 3-4: Test 3 different value propositions with the winning hook Week 5-6: Test 3 different CTAs with the winning hook + value prop
Always test one variable at a time. I've seen companies test 15 completely different ads simultaneously and learn nothing useful.
One B2B client increased ROAS from 3.2 to 7.1 by changing their headline from "Increase Your Sales" to "Add $50K Monthly Revenue in 90 Days." Same audience, same budget — just a more specific promise.
5. Optimize Landing Pages for Revenue, Not Conversions
Here's a controversial take: optimizing for more conversions often hurts ROAS.
A personal injury law firm asked us to increase their lead volume. Easy enough — we could triple leads by removing the phone screening form. But those leads would be garbage. Lower-quality leads mean lower case values and worse ROAS.
Instead, we optimized for lead quality:
- Added qualifying questions to filter out non-viable cases
- Required phone number AND email for serious inquiries
- Created separate landing pages for different case types
Lead volume dropped 20%. Revenue per lead increased 180%. Overall ROAS jumped from 4.2 to 11.8.
Sometimes the best optimization is making it harder to convert.
6. Implement Dynamic Bidding Based on Lifetime Value
Most people bid the same for a customer worth $100 and one worth $1,000. That's insane.
If you know your customer segments' lifetime values, bid accordingly:
High-LTV Segment (Corporate clients): $500 LTV → $150 max cost per acquisition
Medium-LTV Segment (Small businesses): $200 LTV → $60 max cost per acquisition
Low-LTV Segment (Individual users): $50 LTV → $15 max cost per acquisition
Google and Facebook's automated bidding can't differentiate between these segments unless you tell them. Create separate campaigns with appropriate bid caps for each value tier.
7. Use Dayparting and Geographic Optimization
Not all hours and locations convert equally. But most campaigns run 24/7 across entire countries.
We analyzed conversion data across 50+ accounts and found:
Peak Performance Windows:
- B2B: Tuesday-Thursday, 10 AM - 4 PM (2.3x higher conversion rates)
- E-commerce: Sunday-Tuesday, 7-10 PM (1.8x higher conversion rates)
- Local services: Monday-Friday, 8 AM - 6 PM (3.1x higher conversion rates)
Geographic Patterns:
- Urban areas: 40% higher conversion rates but 60% higher costs
- Suburban areas: Sweet spot for most industries (balanced cost/conversion)
- Rural areas: Often unprofitable except for specific industries
Pause campaigns during low-performing windows and reallocate budget to peak hours. One client improved ROAS by 35% just by stopping weekend B2B campaigns.
8. Build Retargeting Sequences That Actually Sell
Most retargeting campaigns show the same ad to someone who visited once and someone who abandoned checkout. That's like using the same sales pitch for a cold prospect and a warm lead.
Here's our retargeting sequence framework:
Sequence 1 - Website Visitors (Haven't Seen Pricing)
- Day 1-3: Social proof and case studies
- Day 4-7: Product demonstrations
- Day 8-14: Pricing and special offers
Sequence 2 - Pricing Page Visitors
- Day 1-2: Address common objections
- Day 3-5: Limited-time incentives
- Day 6-10: Competitor comparisons
Sequence 3 - Cart Abandoners
- Hour 1: Simple reminder
- Day 1: Urgency/scarcity
- Day 3: Discount offer
- Day 7: Final reminder with social proof
This approach increased retargeting ROAS from 2.8 to 8.4 for an e-commerce client. Different messages for different intent levels.
Advanced ROAS Optimization Techniques for 2026
AI-Powered Bid Optimization
Google's Smart Bidding has gotten smarter, but it needs quality data to work. Feed it conversion values, not just conversion counts.
Set up value-based bidding strategies:
- Target ROAS (if you have consistent margins)
- Maximize conversion value (if margins vary by product)
- Custom goal combinations (ROAS + volume targets)
But here's the catch — AI bidding needs 15-30 conversions per week to optimize effectively. If you're getting fewer conversions, stick with manual bidding until you reach that threshold.
Cross-Channel Attribution Modeling
Single-channel ROAS calculations are fiction. Customers see your Facebook ad, search for your brand on Google, and buy after clicking an email.
At Seen By Many, we use unified tracking to see the complete customer journey. A "failing" Facebook campaign with 1.2 ROAS might actually drive 40% of your Google branded searches.
Tools like Triple Whale or Wicked Reports show cross-channel impact. One client discovered their "unprofitable" YouTube campaigns generated $180,000 in attributed revenue across other channels.
Seasonal ROAS Planning
ROAS fluctuates predictably throughout the year. Plan budgets and expectations accordingly:
Q4 (Oct-Dec): Higher costs, higher competition, but often higher conversion rates Q1 (Jan-Mar): Lower costs, great for testing new campaigns Summer months: Vary dramatically by industry
We increase budgets 40% during each client's peak season and pause underperforming campaigns during slow periods. Better to dominate your best months than spread budget evenly across bad ones.
Common ROAS Optimization Mistakes That Kill Performance
Mistake #1: Optimizing Too Early
Google and Facebook need time to learn. Making daily budget changes based on yesterday's performance is like adjusting your diet based on this morning's weight.
Wait at least 7 days before making major changes. Wait 14 days for demographic or interest targeting adjustments. The algorithms need data to optimize effectively.
Mistake #2: Focusing Only on Front-End ROAS
A 2.0 ROAS campaign might outperform a 6.0 ROAS campaign if the first one brings higher-LTV customers.
Track 30-day, 60-day, and 90-day ROAS for every campaign. Some channels (like YouTube or podcast advertising) shine in long-term attribution but look mediocre in short-term reports.
Mistake #3: Ignoring Profit Margins by Product
Not all sales are created equal. A $1,000 software sale with 90% margins beats a $2,000 hardware sale with 15% margins.
Create separate campaigns for high-margin vs. low-margin products. Bid aggressively for profitable products and conservatively for thin-margin ones.
How Pay-Per-Result Changes the ROAS Game
Traditional agencies charge 15-20% of ad spend regardless of results. Their incentive is to spend more of your money, not generate better returns.
This is exactly why we built Seen By Many as a pay-per-result agency. We charge per customer delivered, not per dollar spent. When ROAS goes up, we make more money. When campaigns waste budget, we literally lose money.
Think about whose incentives are actually aligned with your bottom line.
The traditional model optimizes for spend. The pay-per-result model optimizes for profitable growth. Guess which one delivers better ROAS?
Measuring Long-Term ROAS Success
Short-term ROAS spikes are easy. Sustainable ROAS improvement requires systematic measurement:
Weekly Metrics:
- ROAS by campaign and channel
- Cost per acquisition trends
- Conversion rate changes
Monthly Metrics:
- Customer lifetime value by acquisition source
- Profit margins by product/service
- Cross-channel attribution impact
Quarterly Metrics:
- Market share growth
- Customer retention rates
- Competitive positioning
The businesses doubling their ROAS aren't chasing quick wins. They're building systems that compound over time.
If you want to see what systematic ROAS optimization looks like for your business, we should talk. But only if you're serious about measuring what actually matters — profit, not just vanity metrics.
Frequently Asked Questions
What is a good ROAS for different industries?
Most e-commerce businesses should target 3.5+ ROAS, while service-based businesses often see 5-15+ ROAS due to higher margins. However, your target ROAS should be based on profit margins, not industry averages — a 3.0 ROAS with 50% margins is better than 5.0 ROAS with 20% margins.
How do you calculate and improve ROAS?
ROAS equals revenue divided by ad spend, but track profit-based ROAS for better decision-making. Improve ROAS by eliminating wasteful keywords, segmenting audiences by purchase intent, and testing creative systematically — these three changes alone typically improve ROAS by 40-80%.
What factors affect ROAS the most?
Audience targeting quality impacts ROAS more than any other factor, followed by landing page optimization and creative performance. Poor conversion tracking makes everything else irrelevant — fix your attribution first, then optimize campaigns based on accurate data.
How can AI help optimize ROAS?
AI-powered bidding strategies work best when fed conversion values (not just counts) and given 15+ weekly conversions to optimize effectively. Tools like Google's Target ROAS and Facebook's Value Optimization can improve performance by 20-40% once they have sufficient data to learn from.
What's the difference between ROAS and ROI?
ROAS measures advertising efficiency (revenue ÷ ad spend) while ROI measures overall profitability including all costs. A 4.0 ROAS might equal 50% ROI or -10% ROI depending on your margins — always calculate both metrics to understand true campaign performance.
Stop Paying for Ads That Don't Work
We generate new customers for your business. You only pay for results. No retainers. No risk.
Let's Talk GrowthDaniel Hristov
CEO & Founder at Seen By Many
Daniel Hristov is the founder of Seen By Many, an AI-powered advertising agency that charges per qualified customer delivered. With deep expertise in Meta, Google, TikTok, and YouTube advertising, he helps businesses scale with pay-per-result campaigns.
Related Articles

Pay-Per-Result Advertising: Why Smart Businesses Are Ditching Retainers in 2026
Discover how pay-per-result advertising works, why it outperforms traditional retainer models, and how to find the right performance-based agency. Expert insights from Seen By Many.
How to Pay Per Performance When You Advertise (And Stop Wasting Money)
Explain the pay-per-performance model in plain English — why it exists, how it works, and why most agencies hate it (because they'd actually have to deliver results). Written with authority from running $10M+ in performance campaigns.. Expert insights on pay per performance advertising from Seen By Many.
Pay-Per-Result Advertising: Why Smart Businesses Choose This in 2026
Industry analysis comparing traditional agency models vs pay-per-result, featuring client testimonials and specific ROI data that demonstrate why this model is becoming the preferred choice. Expert insights on pay-per-result advertising from Seen By Many.